









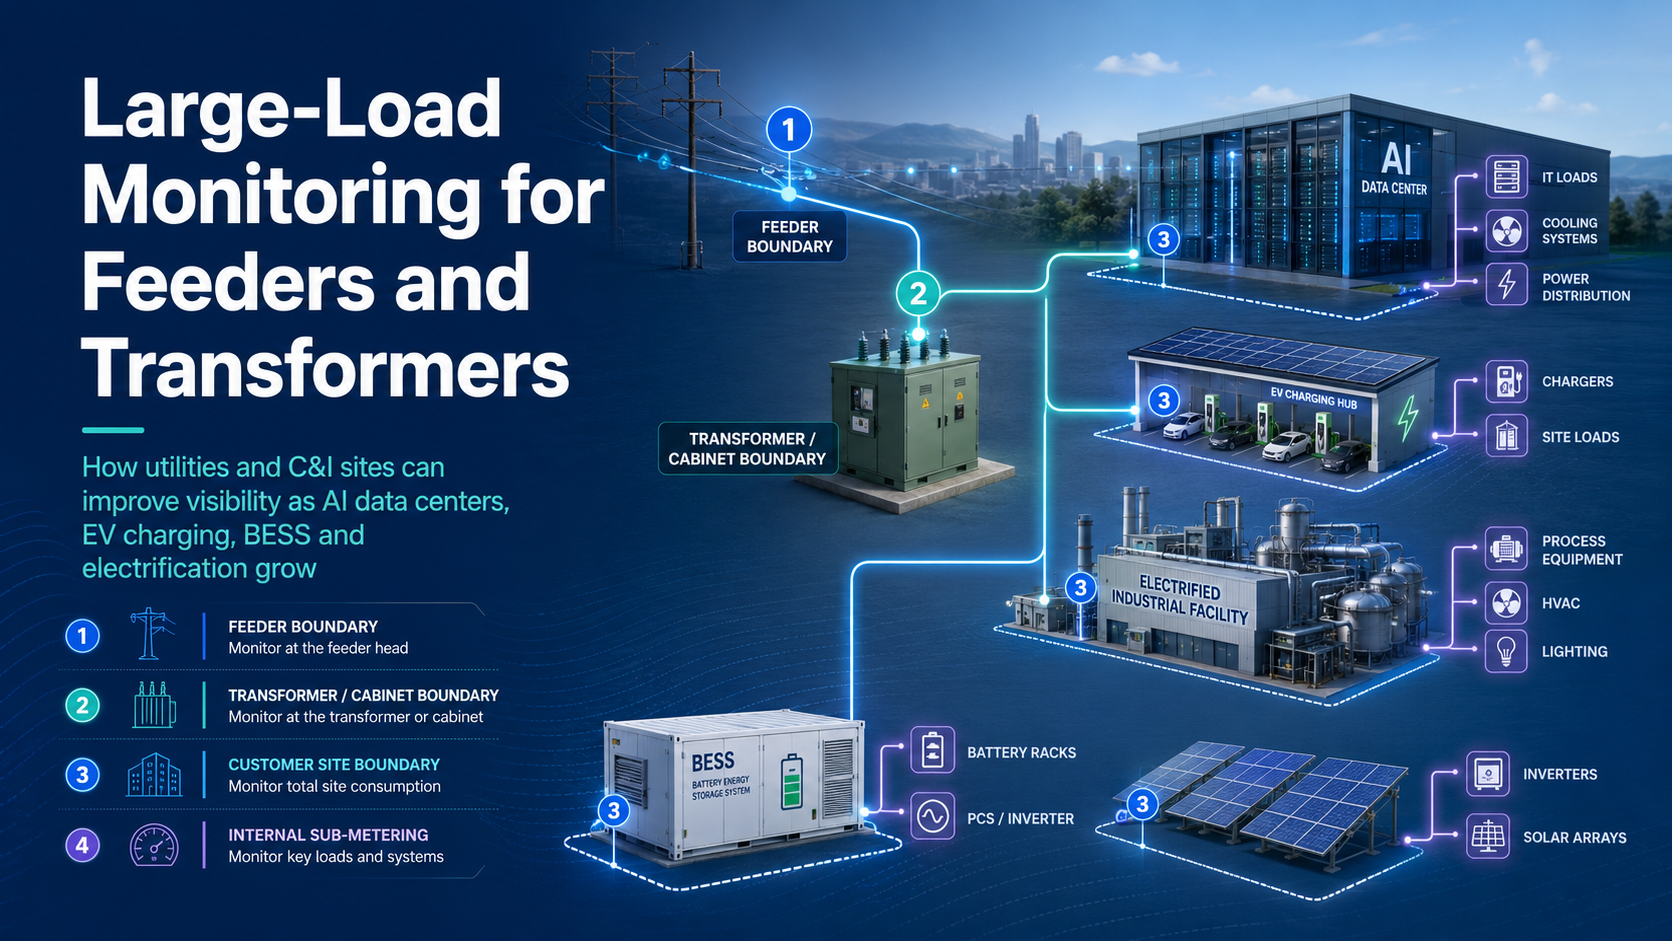
Large electrical loads are no longer only a customer-side energy-management issue. AI data centers, EV charging hubs, electrified manufacturing, battery energy storage systems (BESS), heat pumps and distributed solar can all change how local feeders and distribution transformers are loaded.
For utilities, industrial parks and commercial or industrial sites, the practical question is not only how much electricity a customer uses in a month. The more useful questions are where the load appears, when it peaks, whether several loads are coincident, whether power flows reverse, and which measurement boundary should be used for planning, operations, cost allocation or internal energy management.
The first answer is simple:
A large-load monitoring design should normally separate four measurement layers: the feeder, the distribution transformer or cabinet, the customer site boundary and the internal load circuits. Each layer should use time-aligned data, clear CT or direct-connection settings, verified register mapping and a defined data purpose.
Energy meters provide the field measurement layer. They do not replace utility planning studies, protection coordination, SCADA, EMS, BMS, DCIM, BESS controllers or final grid-connection approval.
Why Large Loads Are Becoming a Distribution-Level Measurement Problem
Several July 2026 developments show why local grid visibility is moving higher on the planning agenda.
On 8 July 2026, Indian power minister Manohar Lal said India’s peak power demand is expected to reach about 300 GW in 2027, with data centers, AI and EVs among the drivers reported by Economic Times. In North America, AP reported on 8 July 2026 that Meta announced a multibillion-dollar AI data center project in Alberta, Canada, supported by new power infrastructure. These are large-load examples, but the same logic applies to EV charging depots, industrial electrification and logistics facilities.
Regulators are also paying closer attention. On 18 June 2026, the U.S. Federal Energy Regulatory Commission (FERC) issued orders requiring six regional grid operators to justify or reform tariff provisions for large-load integration. The orders address topics such as transmission study processes, cost transparency, co-location, behind-the-meter generation and flexible large loads. They do not create a single metering specification, but they show that large-load connection data is becoming a formal planning issue.
At the same time, renewable generation and storage are adding more bidirectional behavior to networks. On 8 July 2026, pv magazine reported that ICRA estimated about one-third of India’s recently commissioned renewable energy capacity faced curtailment because transmission expansion was lagging generation additions. Energy-Storage.News also reported July 2026 projects in the Netherlands and Japan where storage is being used or promoted around grid congestion and solar output-control challenges.
The shared message is clear: annual kWh and basic monthly billing data cannot explain feeder loading, transformer utilization, coincident peaks or local hosting capacity on their own.
How This Article Differs from Related YTL Pages
This article focuses on feeder and transformer load monitoring. It is designed to sit between existing YTL resources rather than duplicate them:
- For utility-facing data center interconnection requirements, see Large Load Grid Connection: What Data Centers Should Measure and Document Before Interconnection.
- For broad grid-constraint metering architecture, see How Grid Constraints Are Reshaping Energy Metering and System Design.
- For C&I demand and capacity-charge terminology, see Understanding the Demand of an Electricity Meter.
- For internal C&I sub-metering, see DIN Rail Energy Meters for C&I Energy Management.
The specific gap addressed here is the practical metering question for shared distribution assets: what should be measured at feeders, transformers, distribution cabinets and customer boundaries when large loads grow?
The Four Measurement Layers for Large-Load Visibility
A large-load monitoring design should not treat every meter reading as the same kind of data. The measurement boundary determines what the data means.
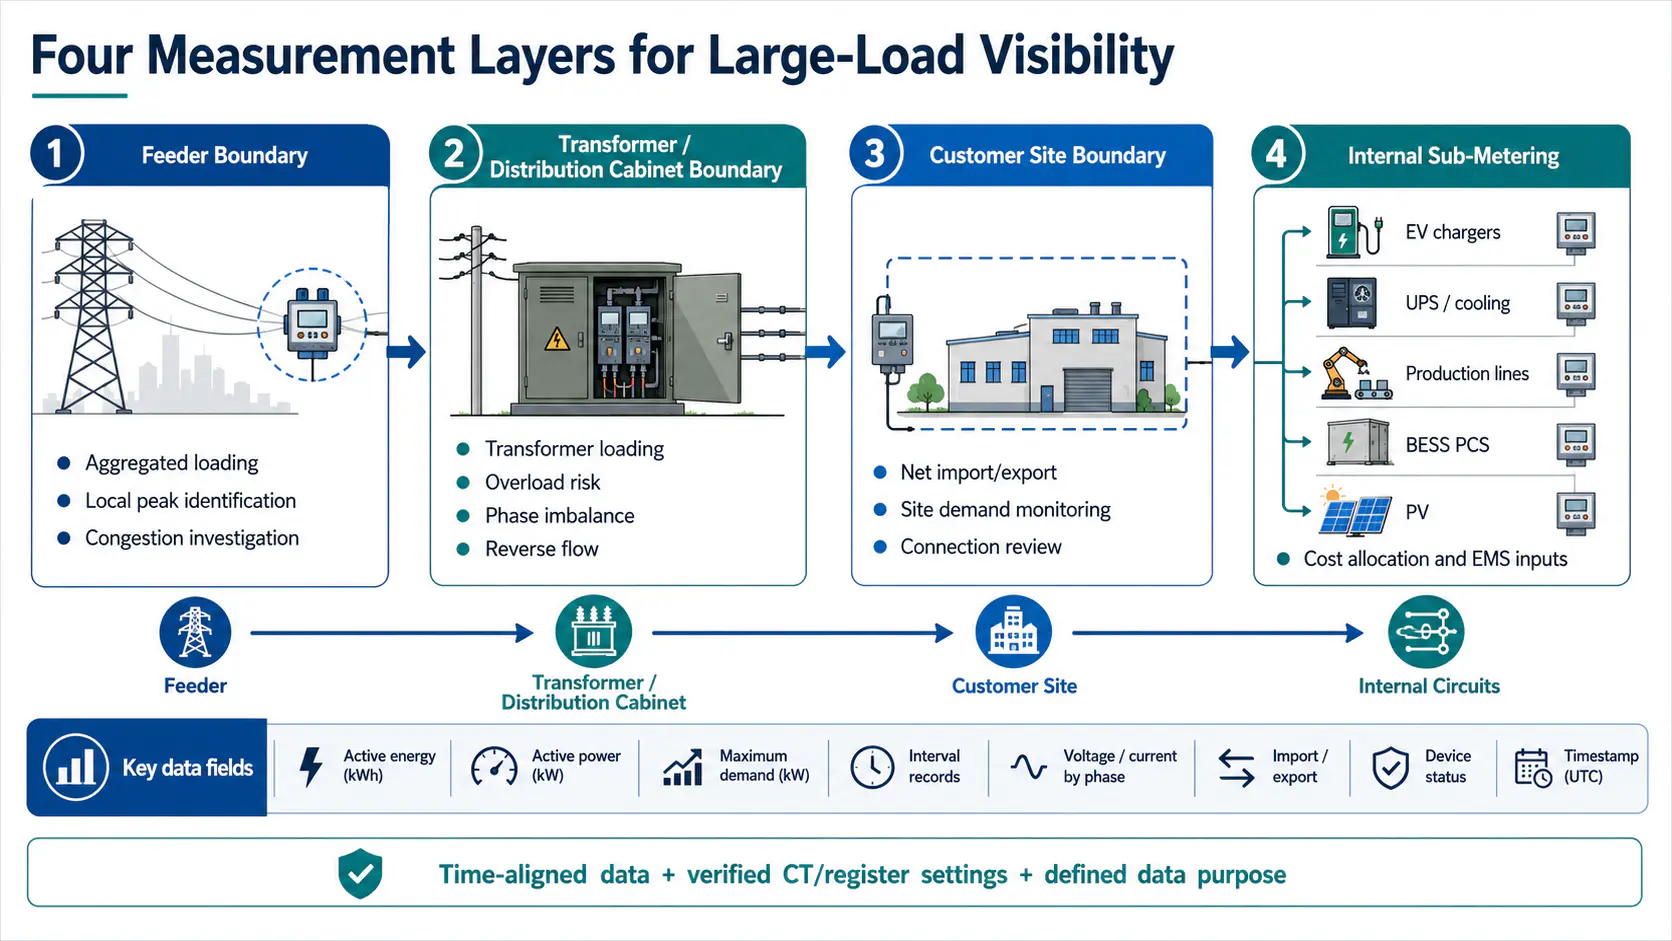
| Measurement layer | What it shows | Typical use | Important limitation |
| Feeder boundary | Aggregated loading across a feeder or feeder section | Feeder load monitoring, load growth analysis, local peak identification, outage or congestion investigation | Does not identify which individual customer or internal load caused the peak without downstream data |
| Transformer or distribution-cabinet boundary | Loading on a shared transformer, LV cabinet or local distribution asset | Transformer load monitoring, overload risk review, phase imbalance analysis, local asset planning | It shows the net effect of downstream loads and generation, not the internal behavior of every site |
| Customer site boundary | Net import or export at the customer incomer or utility-defined point | Site demand monitoring, bill reconciliation support, large-load connection review, import/export tracking | It may hide internal load shifts, storage cycling or PV generation behind the boundary |
| Internal sub-metering | Load contribution of circuits such as EV charging, UPS, cooling, production lines, BESS PCS or tenant panels | Root-cause analysis, cost allocation, EMS inputs, operational optimization | It is not automatically the utility billing or settlement boundary |
These layers should be time-aligned before comparisons are made. A feeder peak, transformer peak and site peak may occur at different moments. Adding separate maximum values from different meters can overstate the actual system peak if the values were not recorded in the same interval.
What Feeder Load Monitoring Should Measure
Feeder load monitoring is useful when a utility, campus operator or industrial park needs to understand how a group of loads affects a local network section.
Relevant measurements may include:
- Active energy and active power.
- Reactive power and power factor where relevant to the network study.
- Voltage and current by phase.
- Maximum demand over the defined interval.
- Import and export direction.
- Interval load profile.
- Phase imbalance.
- Communication and device-status information.
- Timestamp, time zone and clock-synchronization status.
The feeder meter or monitoring device should be selected according to the actual electrical point. A feeder or cabinet with higher current will commonly require a CT-operated metering arrangement. CT ratio, polarity, burden, wiring, phase mapping and register scaling must be checked during commissioning. A communication interface such as RS485 or Modbus does not by itself prove that data is valid for billing, settlement, grid approval or a specific SCADA/EMS integration.
For YTL product-category review, relevant starting points may include smart meters, data concentrators, panel meters and multi-function energy meters. The exact model, wiring, current-sensing method, communication interface, register map and intended use must be confirmed for each project.
What Transformer Load Monitoring Should Measure
A distribution transformer can become the practical bottleneck even when the wider grid has available energy. Large EV chargers, data center feeders, industrial motors, heat pumps or BESS charging can create local transformer peaks.
Transformer load monitoring should help answer:
- How close is the transformer to its operating limit during peak intervals?
- Are peaks driven by one customer, several coincident customers or a temporary operating condition?
- Are the phases balanced?
- Is local PV export causing reverse power flow at certain times?
- Does BESS charging create a new local peak?
- Are voltage conditions becoming difficult during high-load or high-export periods?
- Is the transformer load profile changing seasonally or after new large loads connect?
Transformer-level monitoring is not the same as customer-billing metering. It is normally a network-asset visibility layer. If the same data is intended for regulatory reporting, cost allocation, loss analysis or another formal purpose, the applicable utility, legal metrology and data-validation rules should be checked separately.
Why Site-Boundary Data Is Still Required
Feeder and transformer data show how the local network asset is loaded. Site-boundary data shows how one customer or facility interacts with the grid at its defined connection point.
This distinction matters for AI data centers, EV charging hubs and industrial facilities. A data center may have UPS systems, cooling loads, backup generation and BESS behind the meter. An EV depot may stagger charger output through a charger-management platform. A factory may shift production or start multiple large motors at the same time. A site with PV and storage may import, export, charge and discharge in different intervals.
Only the site-boundary meter or utility-defined point can show the net result at that boundary. Internal meters explain why the site-boundary result happened.
For a data center-specific view of POI, UPS, cooling, DCIM and utility data consistency, see YTL’s data center interconnection metering guide and data center energy meter application page.
Internal Sub-Metering Explains the Peak Contributors
Internal sub-metering is useful when the operator needs to identify which loads contribute to a feeder, transformer or site peak.
Typical internal monitoring points include:
- Data center UPS input and output boundaries, PDU feeders, cooling systems and auxiliary loads.
- EV charger feeders, charger groups and depot-level incomers.
- Industrial production lines, compressors, HVAC, pumps, motors and tenant panels.
- BESS PCS AC-side measurement, auxiliary load and grid-connection meter.
- Building sub-distribution boards and major flexible loads.
DIN rail energy meters may be considered for selected lower-current sub-circuits, distribution boards or C&I sub-metering points where the selected model matches the voltage, phase, current, accuracy, communication and installation requirements. For higher-current circuits, CT-operated meters are often considered, subject to the selected meter and CT arrangement.
For related product-category pages, see single-phase DIN rail energy meters, three-phase DIN rail energy meters and EV charging energy meters.
The Data Fields That Matter Most
Not every project requires every data field. The required dataset should be based on the project purpose, measurement boundary, tariff or study requirement and integration architecture.
| Data field | Why it may be needed | Boundary where it is often useful | What to confirm |
| Active energy | Energy reconciliation and interval aggregation | Feeder, transformer, site, internal loads | Register direction, multiplier, rollover and unit |
| Active power | Current loading and operational visibility | Feeder, transformer, site, internal loads | Meter update behavior and polling design |
| Maximum demand | Peak-load analysis | Feeder, transformer, site | Interval, reset rule and fixed/rolling calculation |
| Interval records | Load-profile reconstruction | Feeder, transformer, site, selected internal points | Storage interval, retention, timestamp and missing-data handling |
| Voltage and current by phase | Phase imbalance and local asset loading | Feeder, transformer, distribution cabinet | CT polarity, phase mapping and wiring |
| Reactive power and power factor | Network operation and apparent-power analysis where relevant | Feeder, transformer, large sites | Tariff or network relevance and model support |
| Import/export values | Bidirectional flow from PV, BESS or regenerative processes | Site boundary, transformer, feeder, BESS connection | Sign convention or separate registers |
| Device and communication status | Data-quality interpretation | All digital monitoring layers | Distinguish real low load from missing or stale data |
| Timestamp and time source | Alignment across devices and systems | All time-series data | Time zone, daylight saving, clock drift and synchronization |
Data quality is as important as data quantity. A dashboard that updates frequently does not prove the underlying measurement, storage interval or billing interval has the same time resolution.
How Different Large Loads Appear in Meter Data
Different load types create different monitoring questions.
| Large-load type | Typical metering question | Useful monitoring boundary | Internal data that may explain the result |
| AI data center | Does the site create a new local feeder or transformer peak? | Feeder, transformer, site incomer | UPS, PDU, IT load, cooling load and auxiliary circuits |
| EV charging hub | Do simultaneous charging sessions create a coincident peak? | Transformer, site incomer, charger feeder | Charger group output, schedule, OCPP/charger-management data |
| Electrified manufacturing | Which process contributes to maximum demand? | Site incomer, production feeder, major equipment circuits | Motor starts, batch schedules, compressor and HVAC loads |
| BESS | Does charging create a local peak, and does discharge reduce site net demand? | Grid-connection meter, PCS AC side, site boundary | PCS data, auxiliary load, EMS schedule and battery controller data |
| Distributed PV or hybrid PV+BESS | Does export affect transformer or feeder conditions? | Transformer, feeder, site boundary | Inverter output, battery charge/discharge and auxiliary consumption |
Meters can provide electrical measurements at defined points. They do not determine the operating strategy of a charger-management system, EMS, BESS controller, DCIM platform or industrial control system.
Time Alignment: A Small Detail That Changes the Result
Large-load monitoring often fails when teams compare data that appears similar but has different time rules.
The project team should define:
- Measurement refresh: how often the meter updates a value internally.
- Communication polling: how often a gateway, PLC or platform requests data.
- Storage interval: the time block stored in the meter, gateway, HES, MDM, EMS or database.
- Upload delay: how long it takes for local data to reach the platform.
- Dashboard refresh: how often the user interface changes.
- Billing, settlement or study interval: the interval defined by the tariff, interconnection process or program.
Faster polling cannot create valid high-speed data if the meter’s internal update, storage or register behavior does not support that use. For fast transient analysis, disturbance recording, synchronized phasor measurement or power-quality compliance studies, specialized instruments may be required.
How AMI and Sub-Metering Work Together
Advanced Metering Infrastructure (AMI) and sub-metering solve different problems.
AMI or utility-side smart metering can support customer-boundary interval data, remote reading, outage indication and aggregated load analysis, depending on system design and regulatory scope. Feeder or transformer monitoring can show the condition of shared network assets. Internal sub-metering can explain load contributors within a facility.
For distribution applications, YTL’s Electricity Distribution page and smart meter category can be reviewed as starting points. For projects requiring data collection from multiple devices, data concentrator options may be relevant, subject to communication technology, network design, supported devices and project requirements.
No single meter layer replaces all others. The right architecture depends on whether the project is trying to support utility planning, asset monitoring, internal cost allocation, peak-demand management, flexibility verification or operational control.
What YTL Can Support
YTL can support field-level electrical measurement and meter-data output discussions for selected applications, subject to exact model confirmation.
A useful discussion may include:
- Measurement point: feeder, transformer, cabinet, site boundary or internal circuit.
- Single-phase or three-phase system.
- Nominal voltage and wiring arrangement.
- Expected current range.
- Direct-connected or CT-operated measurement.
- CT ratio, secondary current and polarity requirements.
- Required electrical values and interval data.
- Import/export direction and bidirectional measurement need.
- Communication interface such as RS485 or Modbus, where supported by the selected model.
- Gateway, data concentrator, EMS, BMS, DCIM, HES or MDM integration context.
- Register map, data type, unit, multiplier and byte order.
- Accuracy, certification and documentation requirements for the intended use.
- Internal monitoring, cost allocation, utility data, billing support or another data purpose.
Product capabilities vary by model, hardware version, firmware version, current-sensing architecture, communication option, register map and certification scope. Final system design, grid studies, tariff interpretation, billing acceptance, protection coordination, SCADA/EMS implementation and regulatory approval remain with the relevant utility, EPC, consultant, system integrator, project owner and authority.
Common Mistakes to Avoid
The following mistakes can reduce the value of a large-load monitoring project:
- Using monthly kWh to explain a feeder or transformer peak.
- Adding maximum-demand values from different feeders without confirming they occurred in the same interval.
- Treating customer export data as proof of reverse power flow at the transformer without measuring the upstream boundary.
- Assuming Modbus support means automatic EMS, DCIM, SCADA or billing compatibility.
- Comparing site-boundary data with internal circuit data without aligning timestamps and multipliers.
- Treating BESS battery data as equal to the net change at the grid boundary.
- Ignoring CT ratio, polarity or phase mapping during commissioning.
- Using operational sub-meter data as legal billing or settlement data without the required approval process.
- Expecting a meter to perform the work of an EMS, BMS, DCIM, BESS controller or charger-management platform.
Project Checklist for Feeder and Transformer Load Monitoring
Before selecting meters or gateways, define the project scope:
- Which large load or load group is being monitored?
- Is the main concern feeder loading, transformer loading, site demand, internal cost allocation or flexibility?
- What is the authoritative measurement boundary?
- What interval is required for analysis, tariff review or utility study?
- Does the project involve bidirectional energy flow from PV, BESS or other sources?
- Which values must be measured directly, and which values come from controllers or models?
- Is the circuit direct-connected or CT-operated?
- What CT ratio, polarity and accuracy requirements apply?
- What communication interface and register map are required?
- Which system will store, validate and use the data?
- Is the data for internal monitoring, billing support, utility reporting, interconnection review or another purpose?
- Which party approves the final data use?
This checklist is intentionally practical. The earlier these questions are answered, the easier it is to avoid installing a meter at the wrong boundary or collecting data that cannot support the intended decision.
Conclusion
Large-load growth is pushing utilities and C&I sites to look beyond monthly energy totals. Feeder and transformer load monitoring can show how shared distribution assets are being used, while site-boundary metering shows the customer’s net interaction with the grid and internal sub-metering explains the contributors behind a peak.
The most reliable architecture separates measurement layers, aligns timestamps, confirms CT and register settings, and defines the data purpose before selecting a meter. Energy meters provide the electrical measurement layer. Gateways and concentrators collect and forward data. EMS, BMS, DCIM, charger-management systems and BESS controllers may analyze or act on that data. Utilities, system integrators and project owners determine which data is accepted for planning, billing, control, settlement or approval.
For large-load growth, the value of metering is not only in recording consumption. It is in making the right electrical boundary visible at the right time interval.
FAQ
What is feeder load monitoring?
Feeder load monitoring measures electrical loading at a feeder or feeder section. It can help show time-based demand, phase loading, voltage conditions, import/export behavior and local peak periods, depending on the selected measurement system.
What is transformer load monitoring?
Transformer load monitoring measures the loading and operating conditions of a distribution transformer or related cabinet. It can support overload-risk review, phase-imbalance analysis and local asset planning.
Is feeder data the same as customer site data?
No. Feeder data represents an upstream network boundary and may include multiple customers or loads. Customer site data represents net import or export at the defined customer boundary.
Why is interval data important for large loads?
Interval data shows when load occurs. Monthly kWh can hide short periods of high demand, coincident peaks or BESS charging events that may affect feeder or transformer capacity.
Can smart meters replace feeder or transformer monitoring?
Not always. Customer smart meters can show customer-boundary behavior, but feeder or transformer conditions should be measured at the relevant network asset when that boundary is the subject of analysis.
Can DIN rail meters be used for large-load monitoring?
DIN rail meters may be useful for selected internal circuits or C&I sub-metering points where the selected model matches the electrical and data requirements. Higher-current circuits may require CT-operated metering.
Does Modbus support mean the data is accepted for billing?
No. Modbus is a communication method. Billing or settlement acceptance depends on the exact meter, certification, installation, validation process and applicable utility or legal requirements.
Can BESS reduce transformer peak load?
A BESS may reduce net demand at a transformer or site boundary if it discharges during the relevant interval and is controlled appropriately. The actual result depends on timing, losses, auxiliary load, other simultaneous loads and the defined measurement boundary.
Should feeder, transformer and internal meter data be added together?
Not without checking boundaries and timestamps. These layers often represent overlapping electrical flows. Adding them incorrectly can double count energy or overstate demand.
What information should be sent to YTL for a meter-selection discussion?
Provide the measurement point, phase and voltage system, expected current, direct or CT-operated requirement, CT ratio where applicable, required values, interval needs, communication interface, intended data use and any certification or documentation requirement.
References
- FERC, FERC Launches Aggressive Targeted Action to Speed Large Load Integration, 18 June 2026
- Economic Times, Data centres, AI and EVs to drive peak power demand to 300 GW in 2027, 9 July 2026
- AP, Meta plans billions for first AI data center in Canada, 8 July 2026
- pv magazine, One-third of India’s new renewable energy capacity faces curtailment, 8 July 2026
- Energy-Storage.News, Elestor and Windpark Zeewolde partner on 10-40-hour flow battery project in the Netherlands, 8 July 2026
- Energy-Storage.News, Akaysha Energy begins construction of 82MWh BESS in southern Japan, 8 July 2026
