Maximum Demand, Coincident Peak and Capacity Charges: What C&I Metering Must Measure
Maximum demand is the highest average electrical load recorded over a defined demand interval. A demand charge is a bill component calculated under an applicable tariff or contract. A capacity charge may instead depend on contracted capacity, monthly demand or a site's contribution during a system peak. These concepts are related, but they are not interchangeable.
This distinction has become more important as data centers, electrified manufacturing, EV charging, cooling loads and other large electricity users change regional load profiles.
The U.S. Energy Information Administration's July 2026 Short-Term Energy Outlook forecasts record U.S. electricity use in 2026 and 2027. Reuters has also reported that rising capacity costs associated with rapid data-center growth are affecting manufacturers in parts of the PJM region. In June 2026, the Federal Energy Regulatory Commission directed six regional grid operators to justify or reform rules governing the connection of data centers, manufacturing facilities and other large loads.[1][2][3][4]
For a commercial or industrial facility, however, a higher regional capacity price does not automatically mean that the highest value shown on a local power dashboard is the value used on the electricity bill. The result depends on the tariff, supply contract, distribution company methodology, measurement interval and authoritative billing data.
The first task is therefore not to buy a meter. It is to identify the cost signal, measurement boundary and data rule that the project needs to manage.
This article provides a technical framework for meter and data selection. The applicable utility tariff, electricity-supply contract and market rules remain the controlling references for any billing or capacity-cost decision.
Energy, Power, Maximum Demand and Capacity Are Different Quantities
The following terms are often used together, but they answer different questions.
|
Term |
Typical unit |
What it describes |
Key limitation |
|
Energy consumption |
kWh or MWh |
Total electrical energy used during a period |
Does not show when the load occurred |
|
Active power |
kW or MW |
The rate of electrical energy use at a given measurement point |
A short-duration value is not automatically billing demand |
|
Maximum demand |
kW, MW or sometimes kVA |
The highest average load recorded over a defined demand interval |
The interval and calculation method must match the applicable rule |
|
Non-coincident peak |
kW or MW |
The site's own highest demand, regardless of the wider system peak |
May not determine a system-peak or capacity allocation |
|
Coincident peak |
kW or MW |
Site demand during a utility, zone or system peak |
The qualifying peak hours and allocation method vary |
|
Demand charge |
Currency per kW, kVA or another tariff basis |
A customer bill component based on billing demand under a rate schedule |
The formula is tariff-specific |
|
Capacity market price |
Currency per MW-day or another market unit |
A wholesale price for committed capacity availability |
It is not the same as a meter register or a customer's final bill |
|
Customer capacity obligation or tag |
kW or MW |
A customer's allocated contribution to a capacity requirement |
The assignment method may be market-, utility- and contract-specific |
The EIA defines a demand charge as the portion of an electricity bill based on the customer's maximum electric capacity usage under the applicable rate schedule. It defines a demand interval as the period over which electricity flow is measured, commonly in 15-, 30- or 60-minute increments.[5]
The word capacity needs additional care. It may refer to contracted import capacity, network capacity, a wholesale capacity-market product, or a customer-specific capacity allocation. Before selecting a meter or designing a dashboard, the project team should identify which meaning applies.
Why Monthly kWh Cannot Explain Demand-Related Cost
Consider two industrial sites that each import 100 MWh during the same month.
- Site A spreads its operations more evenly and records a maximum interval demand of 500 kW.
- Site B starts several large loads at similar times and records a maximum interval demand of 800 kW.
Their monthly energy consumption is the same, but their load shapes are different. Under a tariff containing a monthly maximum-demand charge, Site B may have a higher demand-related bill component. Under a system-coincident method, however, the outcome also depends on what each site was doing during the qualifying system peaks.
This example does not calculate a saving because an actual cost comparison requires the site's tariff, contract, billing history, adjustment factors and applicable demand rule.
It is also incorrect to add the individual maximum-demand values of every production line and assume that the result equals the site's maximum demand. Those feeder peaks may occur at different times. A site-level peak must be determined from time-aligned measurements at the defined site boundary or from appropriately synchronized data.
Which Demand Rule Is the Facility Trying to Manage?
The U.S. Department of Energy identifies several common demand-related rate structures.[6] Similar concepts exist in other markets, but names and formulas vary by jurisdiction.
Monthly non-coincident demand
The bill may use the site's highest demand during the billing month, regardless of when it occurs. For this use, the local maximum-demand interval and the tariff interval must align.
The calculation may use fixed blocks or a rolling window. A fixed-block method evaluates separate intervals, such as 10:00–10:15 and 10:15–10:30. A rolling or sliding method updates an average over overlapping windows. The same load event can therefore produce different results under different methods. The tariff rule and the selected meter's supported calculation must be checked rather than assumed.
Time-of-use demand
The tariff may calculate demand only within defined on-peak, shoulder or other time windows. A site-wide monthly maximum outside the qualifying window may therefore not be the billed value.
Demand ratchet or look-back
The billed demand may be the greater of the current value and a defined percentage of one or more previous peaks. Reducing this month's maximum does not necessarily remove the effect of an earlier high-demand event.
Contracted or available capacity
Some tariffs and connection agreements use an agreed capacity limit or subscribed-capacity value. The meter may provide evidence of actual demand, but the contract determines the charge and any exceedance treatment.
System-coincident capacity allocation
In the PJM region, Peak Load Contribution (PLC) is an end-use customer's contribution to the zone's weather-normalized summer peak, as determined by the relevant electric distribution company. PJM publishes five coincident peak values to support EDC calculations, while the exact customer-allocation methodology remains EDC-specific.[7][8]
This is different from simply reading the facility's highest 15-minute demand of the month. A facility can have a high non-coincident peak without having the same load during the qualifying regional peak hours, or vice versa.
What Meter Data Is Needed for Demand Analysis?
The required data set depends on the tariff or program, the measurement boundary and the intended action. Not every project requires every field.
|
Data item |
Why it may be needed |
What to confirm |
|
Import active energy |
Reconcile energy totals and calculate interval averages where applicable |
Register direction, unit, multiplier and rollover behavior |
|
Active power |
Observe current site or feeder loading |
Measurement refresh and communication availability |
|
Maximum demand |
Track the highest demand calculated by the meter |
Demand type, interval, reset rule and supported registers |
|
Interval energy or demand |
Reconstruct the load profile |
Stored interval length, timestamp and missing-data handling |
|
Date and time |
Align data with tariff or system-peak windows |
Clock source, time zone, daylight-saving treatment and drift |
|
Phase current and power |
Identify contributors to a three-phase load peak |
Phase mapping, CT polarity and data availability |
|
Power factor and reactive values |
Investigate apparent-power or power-factor-related cost where relevant |
Tariff relevance and exact model support |
|
Import and export values |
Evaluate sites with on-site generation or storage |
Sign convention or separate registers |
|
Device and communication status |
Distinguish a real low-load interval from missing or stale data |
Status fields, alarms and gateway logic |
Maximum-demand calculation, interval storage, time-stamped records, import/export measurement and communications are model-specific functions. They should be confirmed against the selected meter's current datasheet, hardware and firmware version, register map and intended use.
Six Time Concepts That Should Not Be Mixed
An effective demand-monitoring design distinguishes six separate time characteristics.
|
Time characteristic |
Meaning |
Project risk if misunderstood |
|
Measurement refresh |
How frequently the meter updates a measured value internally |
A slow value may miss the operational detail expected by the EMS |
|
Communication polling |
How often a gateway, PLC or platform requests a value |
Faster polling cannot create data that the meter does not update |
|
Storage interval |
The period used for stored energy or demand records |
It may not match the billing interval |
|
Upload delay |
Time between local collection and delivery to the platform |
Late data may limit operational response |
|
Dashboard refresh |
How frequently the user interface changes |
A fast display is not proof of fast or billing-valid source data |
|
Billing or market interval |
The interval defined by the tariff, contract or program |
Misalignment can produce a different demand value |
A gateway polling a Modbus register every second does not automatically create one-second valid measurement, one-second stored interval data or billing data. The meter's internal update, register behavior, timestamp and data-use scope must be verified separately.
Define the Measurement Boundary Before Selecting the Meter
Demand analysis usually needs at least two levels of measurement.
Site boundary
The site incomer or customer boundary shows the facility's net electrical exchange at the defined point. For bill reconciliation, the authoritative source is normally the utility or contractually accepted billing meter and its approved data process.
Internal feeders and equipment
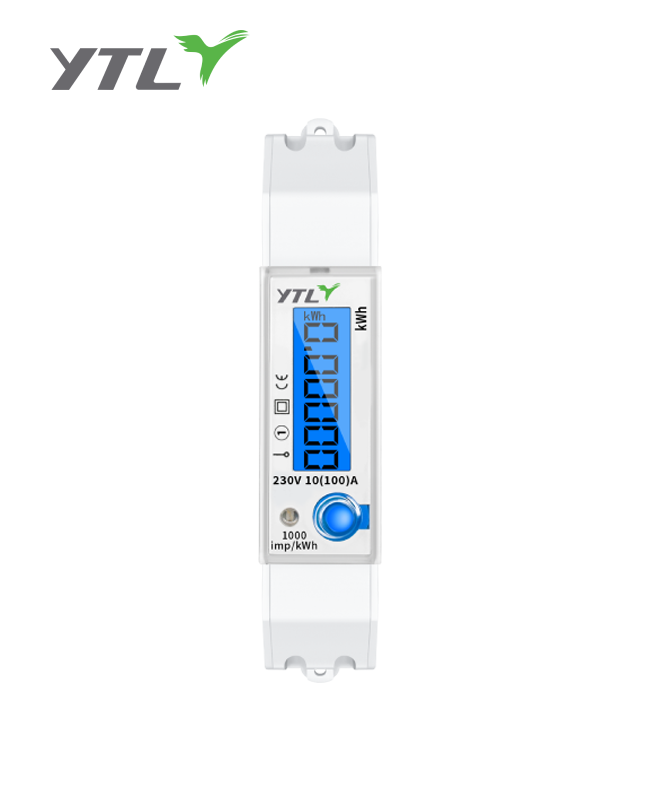
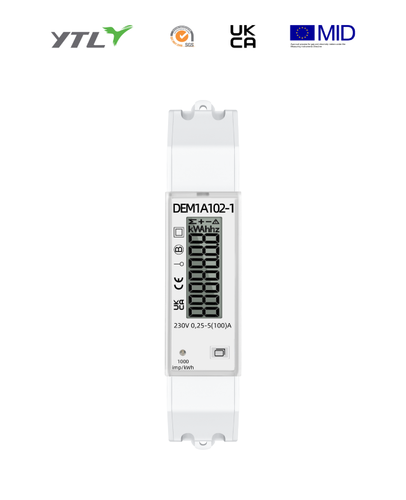
DIN rail or CT-operated meters at production lines, HVAC circuits, EV-charging feeders, tenant panels or other sub-distribution points can help identify which loads contribute to a site peak. These are internal monitoring points unless the applicable billing or sub-billing requirements establish a different status.
The measurement boundary becomes especially important where a site includes PV or a battery energy storage system (BESS). A battery may reduce net grid import if it discharges during the applicable demand interval, but battery-side energy is not automatically equal to the change measured at the grid boundary. PCS conversion, auxiliary consumption, other simultaneous loads and electrical losses affect the site result.
The site-boundary meter measures the net electrical outcome at that point. A battery management system reports battery operating information. A power conversion system controls conversion. An energy management system (EMS) or site controller may decide when to dispatch the asset. These devices have different responsibilities.
Metering Is the Data Layer, Not the Complete Control System
A practical architecture may look like this:
Energy meter → RS485/Modbus or another supported interface → gateway/PLC → EMS or building management system → load controller, charger controller or BESS controller
|
Component |
Primary responsibility |
|
Energy meter |
Measures supported electrical values at the defined point |
|
CT or other approved current-sensing arrangement |
Provides the current input required by the selected metering architecture |
|
Gateway or PLC |
Collects, maps and forwards data; may execute approved local logic |
|
EMS or building management system |
Analyzes data, applies alarms or schedules and may issue control commands |
|
Equipment controller or PCS |
Executes the permitted equipment or storage response |
|
Utility, supplier or market party |
Defines the applicable tariff, allocation, validation or settlement rules |
The meter does not determine the tariff, forecast a regional system peak, create an energy-management strategy or control an industrial process by itself. It provides the field-level measurements that other systems may use.
Direct-Connected or CT-Operated Meter?
The connection method should be selected from the actual electrical point, not from the desired keyword or dashboard function.
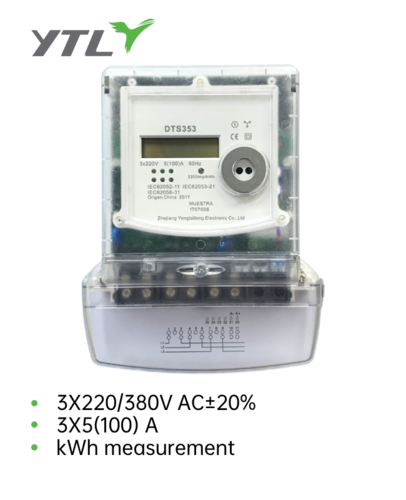
A direct-connected meter carries the measured circuit current through its terminals and may be suitable where the selected model's voltage, phase and current ratings match the circuit. A CT-operated meter receives a secondary current signal from external current transformers and is commonly considered for higher-current three-phase circuits.
For a demand-monitoring project, confirm:
- Single-phase or three-phase system
- Nominal voltage and wiring arrangement
- Maximum continuous current and expected load profile
- Direct connection or CT-operated measurement
- CT primary and secondary values, ratio setting and polarity
- Required active energy, power and maximum-demand data
- Fixed, sliding or other demand calculation requirement
- Required interval storage and retention period
- Time source, time zone and synchronization requirement
- Communication interface, protocol and exact register values
- Accuracy and certification required for the intended use
- Internal monitoring, cost allocation, billing or another data purpose
Supporting RS485 or Modbus does not by itself prove compatibility with a specific gateway, EMS or billing process. Integration should be checked through the physical interface, serial settings, register map, data types, byte order, units, multipliers, polling design and sample testing.
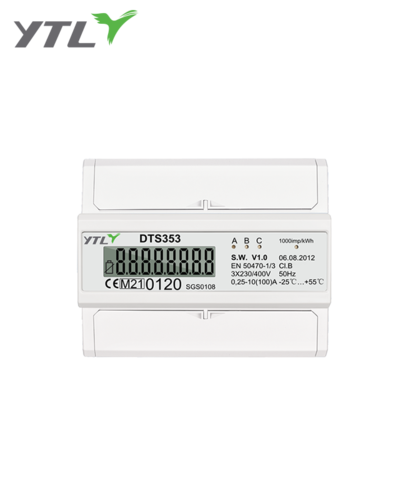
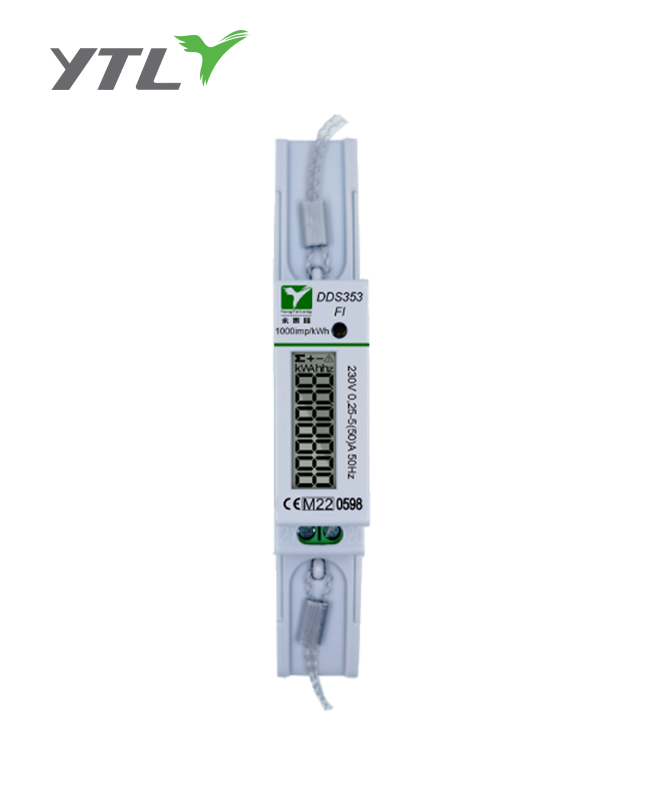
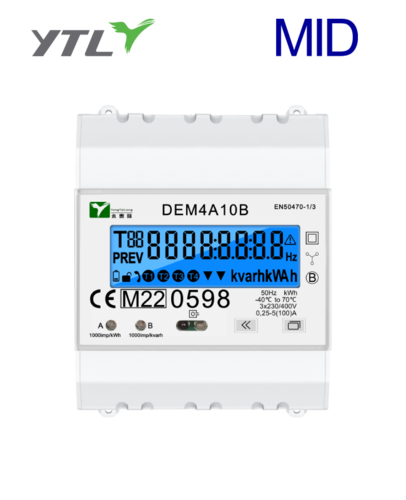
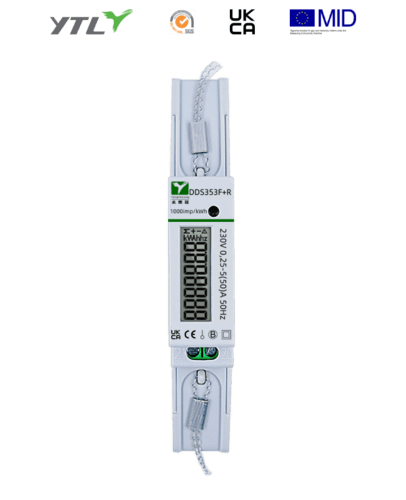
For related selection considerations, see YTL's DIN Rail Energy Meters for C&I Energy Management and CT-Operated Energy Meters resources.
Can a Meter Reduce Capacity or Demand Charges?
Not by itself.
A suitable meter may make the load profile visible, identify peak contributors and provide data to an EMS, BMS, PLC or other platform. A reduction requires an operational action such as staggering equipment starts, shifting a process, adjusting an approved HVAC sequence, changing an EV-charging schedule, curtailing a controllable load or dispatching storage.
Whether that action changes a bill depends on four conditions:
- It occurs at the relevant measurement boundary.
- It occurs during the interval or system-peak window used by the applicable rule.
- The authoritative billing or allocation process recognizes the resulting measurement.
- The operational benefit is not outweighed by production, comfort, equipment, safety or contractual constraints.
Metering should therefore be treated as the evidence layer in a broader demand-management process:
Measure → validate → identify the applicable cost signal → decide → control → verify at the same boundary
For projects involving market or demand-response participation, additional baseline, validation, telemetry and settlement rules may apply. The Demand-Side Flexibility Metering Guide explains these wider responsibilities.
What to Provide for a C&I Meter-Selection Discussion
When discussing a YTL meter for C&I demand monitoring, provide:
- Country and target market
- Applicable tariff, contract or data requirement, if available
- Measurement point and whether it is the site boundary or an internal feeder
- Single-phase or three-phase system
- Nominal voltage and wiring arrangement
- Nominal and maximum current
- Direct-connected or CT-operated requirement
- CT ratio, where applicable
- Required demand type and interval
- Required measured values and stored records
- RS485, Modbus or other interface requirement
- Gateway, PLC, EMS or BMS information
- Billing, non-billing, cost-allocation or operational purpose
- Required certification and documentation
- Estimated quantity and project schedule
Available functions and suitability must be confirmed for the selected model and configuration. Final tariff interpretation, billing acceptance, system design and operational control remain with the relevant utility, supplier, EPC, system integrator, project owner and regulatory parties.
Review YTL energy meter categories or contact YTL to discuss a C&I metering requirement. A useful initial inquiry should include the measurement point, phase and voltage system, current range, CT ratio where applicable, required demand interval, data fields, communication interface and intended use.
Conclusion
Rising electricity demand and higher capacity costs make C&I load visibility more valuable, but kWh, maximum demand, coincident peak and capacity charges describe different parts of the problem.
A reliable project begins by identifying the applicable tariff or allocation rule, defining the measurement boundary and matching the meter's demand interval, timestamp, stored data and communication outputs to that rule. Internal submeters can help locate peak contributors, while the site-boundary or accepted billing data remains the reference for formal bill reconciliation.
The meter supplies measurement data. Gateways and platforms collect and analyze it. Controllers act on approved strategies. Utilities, suppliers and market parties determine which values are accepted for billing or capacity allocation.
Keeping these responsibilities separate helps C&I buyers select the right metering architecture without expecting one device to perform the work of an entire energy-management system.
FAQ
What is maximum demand in an electricity meter?
Maximum demand is the highest average electrical load recorded during a defined demand interval. The value depends on the interval, calculation method, reset period and measurement boundary.
Is maximum demand the same as instantaneous peak power?
No. Instantaneous power is a value at a particular moment. Maximum demand is normally calculated over a defined averaging interval, so a short spike may not create the same demand value.
What is the difference between a demand charge and a capacity charge?
A demand charge is typically a customer bill component calculated from billing demand under a tariff. A capacity charge may refer to contracted capacity or a pass-through based on a market or system-peak allocation. The exact meaning and formula must be checked in the applicable tariff or contract.
Can a DIN rail energy meter help reduce demand charges?
It may provide circuit-level power, energy or demand data where supported by the selected model. Actual reduction requires a separate operational or control action, and the result depends on the tariff and authoritative measurement boundary.
Does a Modbus energy meter provide billing data?
Not automatically. Modbus describes a data-communication method. Billing use depends on the exact meter, accuracy, certification, installation, data process and applicable legal or contractual requirements.
When is a CT-operated meter considered?
A CT-operated meter is commonly considered for higher-current circuits where direct connection is not suitable. The meter input, CT ratio, burden, polarity, wiring, accuracy and intended use must be checked for the selected design.
Can a BESS reduce maximum demand?
A BESS may reduce net demand at the site boundary if it discharges during the relevant interval under an appropriate control strategy. The actual result depends on the tariff, timing, PCS conversion, auxiliary loads, losses and other simultaneous site loads.
Can the maximum demands of several feeders be added to obtain the site peak?
Not unless those values refer to the same time interval and compatible measurement boundaries. Feeder maxima often occur at different times, so adding separate maximum values can overstate the actual site peak.
References
- S. Energy Information Administration, Short-Term Energy Outlook, July 2026, July 7, 2026.
- Reuters, US power use to beat record highs in 2026 and 2027 as AI use surges, EIA says, July 7, 2026.
- Reuters, Big Tech data centers are driving up power bills at America's Rust Belt factories, July 7, 2026.
- Federal Energy Regulatory Commission, FERC Launches Aggressive Targeted Action to Speed Large Load Integration, June 18, 2026.
- S. Energy Information Administration, Glossary: Demand charge and demand interval.
- S. Department of Energy, Evaluating Your Utility Rate Options.
- PJM Interconnection, Manual 19: Load Forecasting and Analysis, Revision 38, effective December 17, 2025.
- PJM Interconnection, PJM Glossary, entries for Coincidental Peaks and Peak Load Contributions.

English
简体中文


.png?imageView2/2/w/500/h/500/format/png/q/100)

.png?imageView2/2/w/500/h/500/format/png/q/100)